Thermal Imaging – Here’s how it works:
A special lens focuses the infrared light emitted by all of the objects in view.
The focused light is scanned by a phased array of infrared-detector elements. The detector elements create a very detailed temperature pattern called a thermogram. It only takes about one-thirtieth of a second for the detector array to obtain the temperature information to make the thermogram. This information is obtained from several thousand points in the field of view of the detector array.
The thermogram created by the detector elements is translated into electric impulses.
The impulses are sent to a signal-processing unit, a circuit board with a dedicated chip that translates the information from the elements into data for the display.
The signal-processing unit sends the information to the display, where it appears as various colors depending on the intensity of the infrared emission. The combination of all the impulses from all of the elements creates the image.
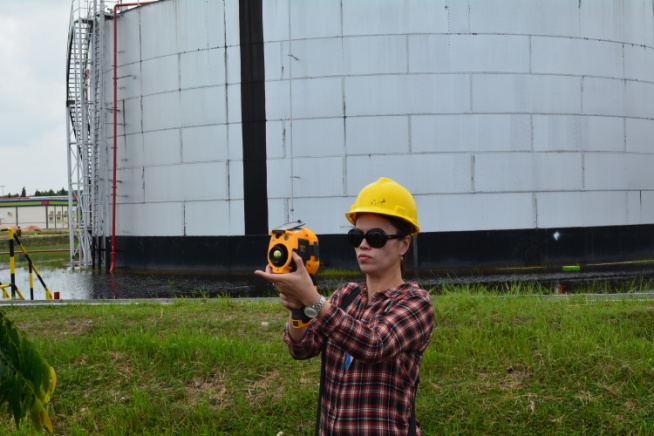
We utilize the Fluke range of Imagers and normally use a Ti-400 Imager by Fluke which has 320×240 pixels. This makes for an accurate and clear representation of the multiple images that we capture. We are able to collect data on the accumulated sludge in most crude oil tanks, un-insulated piping, pipelines, production facility, evaporation and condensing towers or most associated equipment with improved accuracy.
Our specialised technician goes to site and makes a “Thermal Image” of the target piping, tanks, equipment etc to do a diligent report to enable us to identify clearly any problem areas. This is a highlt focused method to help design remediation ptogrammes. Our Technicians on each site can track record data log on any changes arising from from field trials through to contractual agreements.
Our reporting programme provides full details from start to finish of all the processes leading up to full mobilization of the oil.


